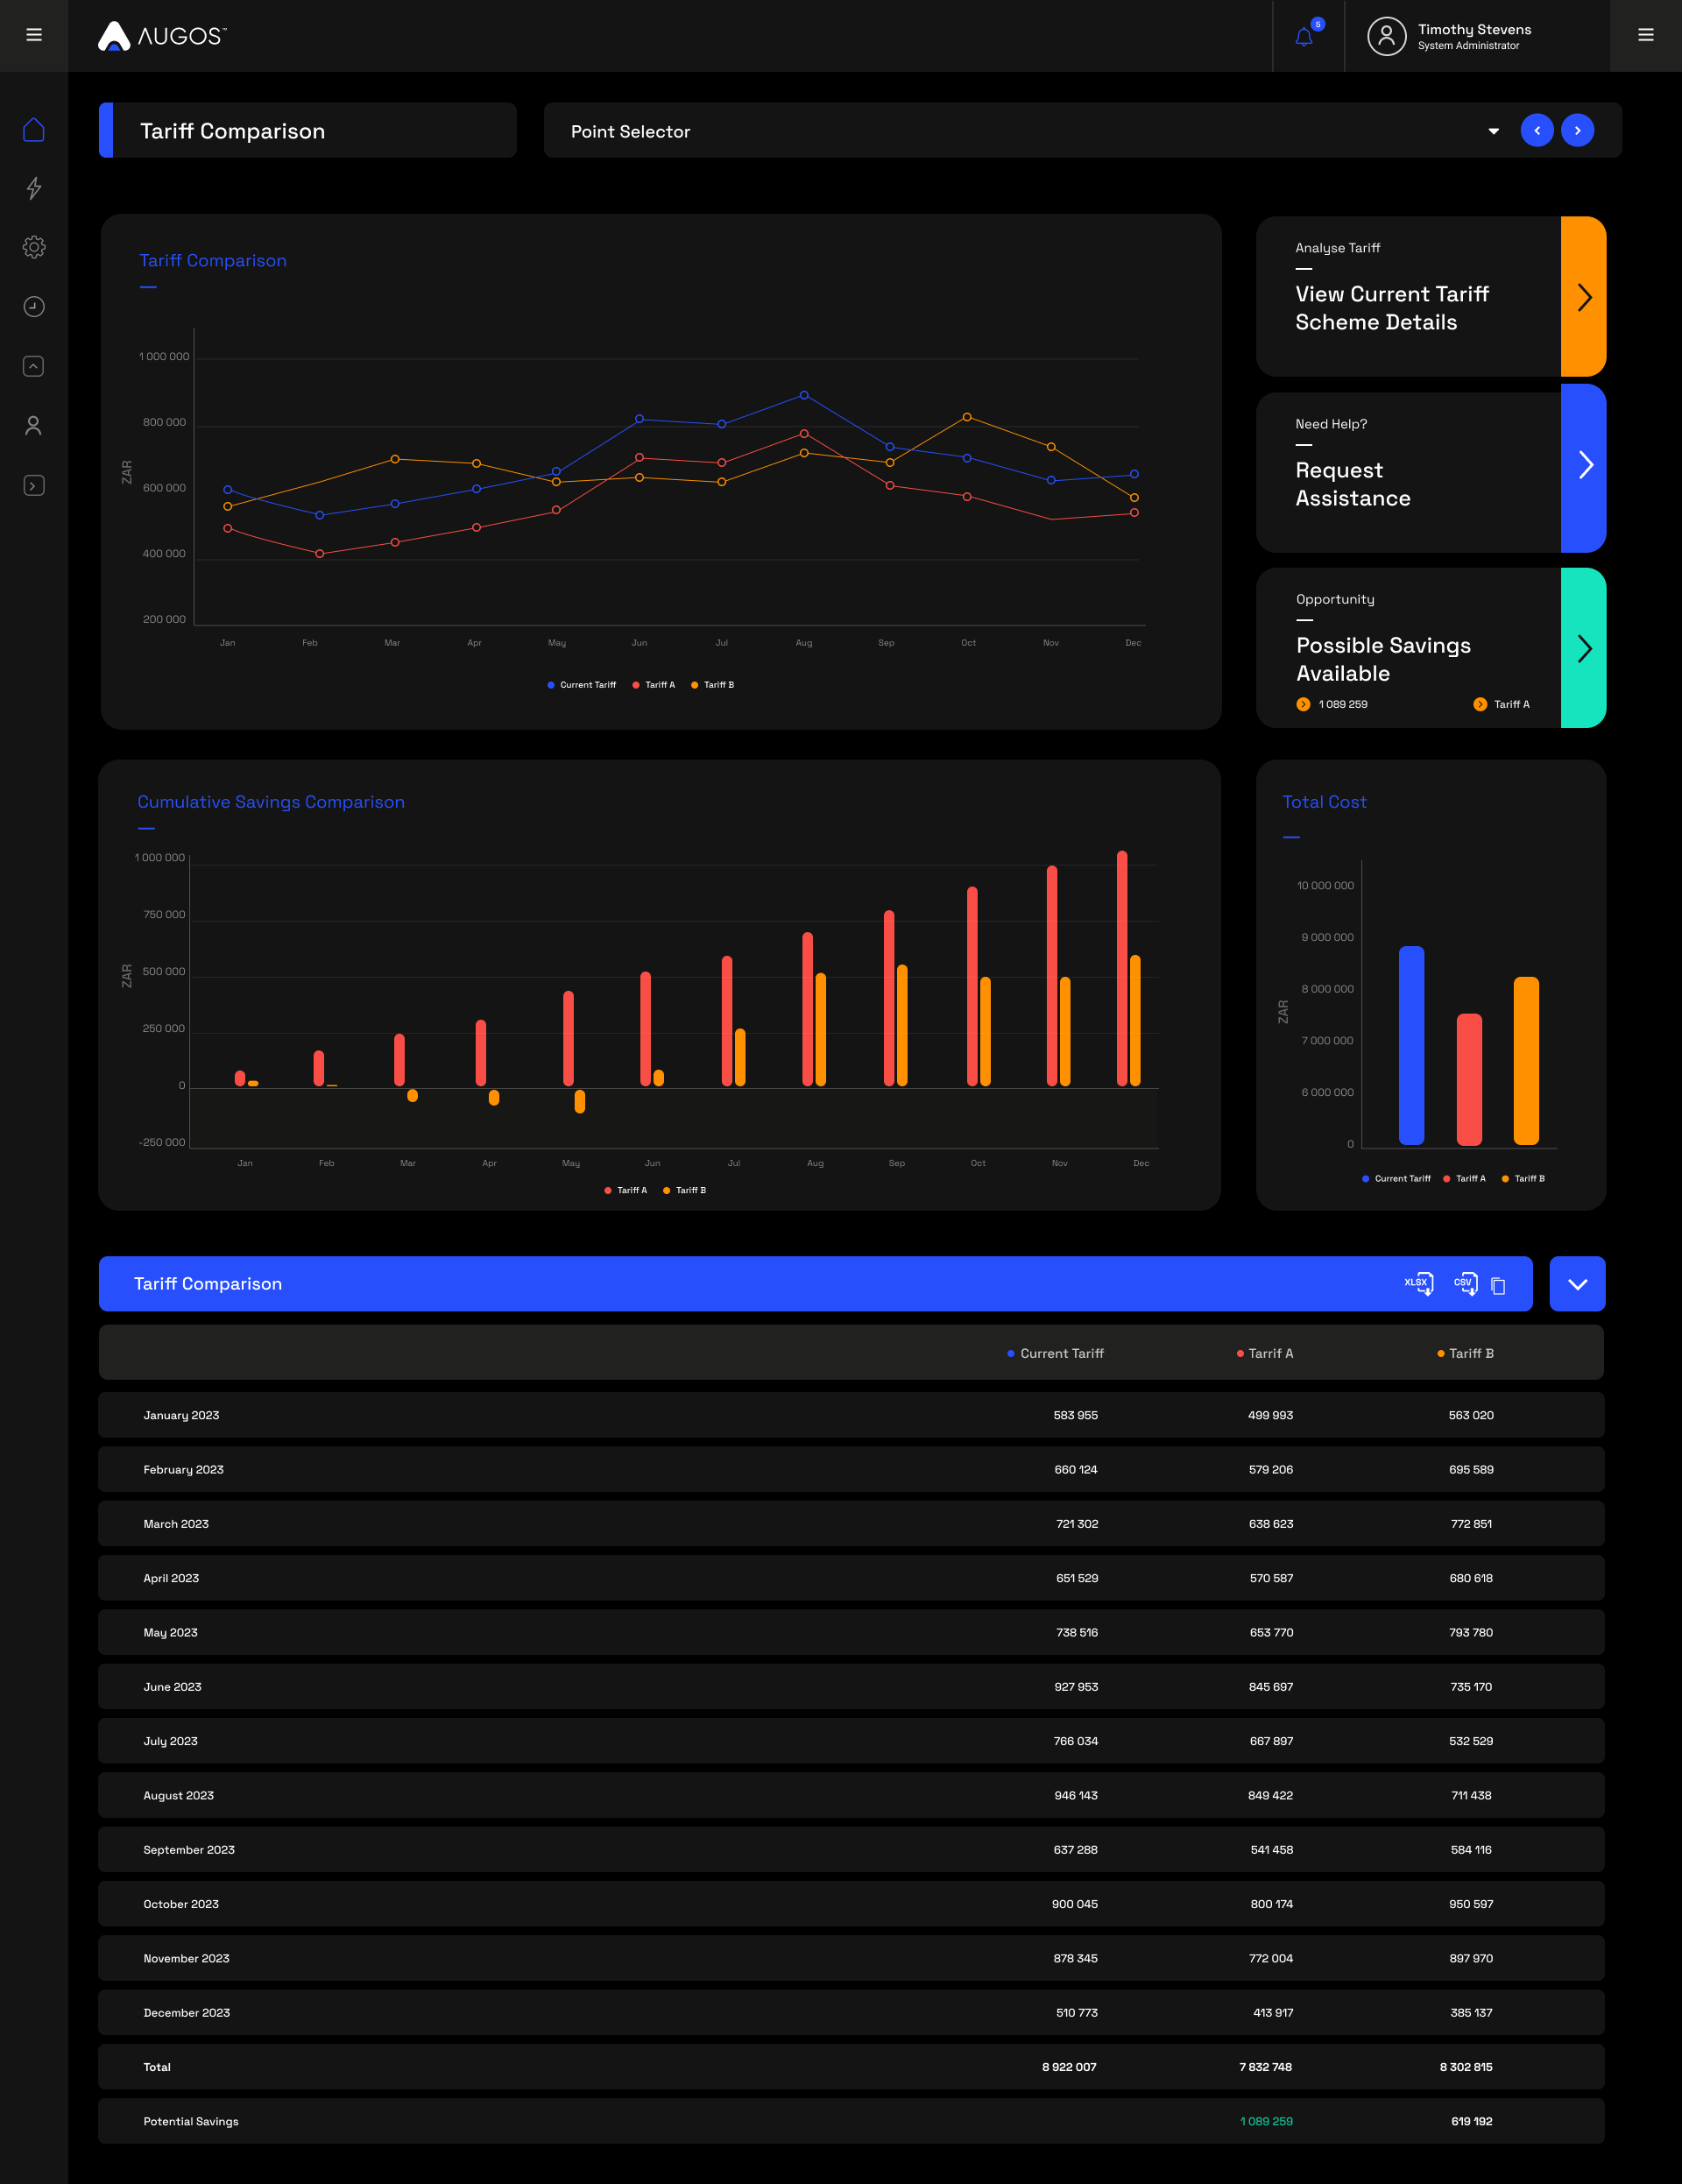
Page Overview - Tariff Comparison
- Purpose of Page
The purpose of this page is to allow customers to compare their current electricity tariff, with other available tariffs in order to see if any savings potential is available through a tariff migration. Customers do not have free choice of tariffs to migrate to. They should consider: - It is important to understand that the tariff must be within the existing utilities NERSA approved list of available tariffs.
- Each utilities have a set of rules for each tariff that governs which sites are able to migrate to specific tariffs. These could include but are not limited to:
- Site Type (Residential, commercial, industrial)
- Site Location (Eskom Local/Non Local)
- Site Voltage
- Site Transformer ownership
- Site Maximum Demand
- Notified Maximum Demand
- Site load factor
- Most Sites should have a standard set of comparative tariffs loaded that are based on a broad ruleset that has been applied across all sites/tariffs on the platform.
- These comparative tariffs are not necessarily the only options available to the site.
- These comparative tariffs are not necessarily available to the site based on specific rules.
- Contact support@augos.io and ask one of our representatives to assist with loading specific required tariffs to your sites profile.
- All tariff comparison data should be verified by an Augos representative before taking action based on the data.
- Augos is able to assist customers with the full verification and tariff migration process. Contact support@augos.io for assistance.
- Point Selector
Only "Sites" can be selected on this page.
- Date Selector
No Date selector is available on this page. It will automatically look at the latest available 12 month period.
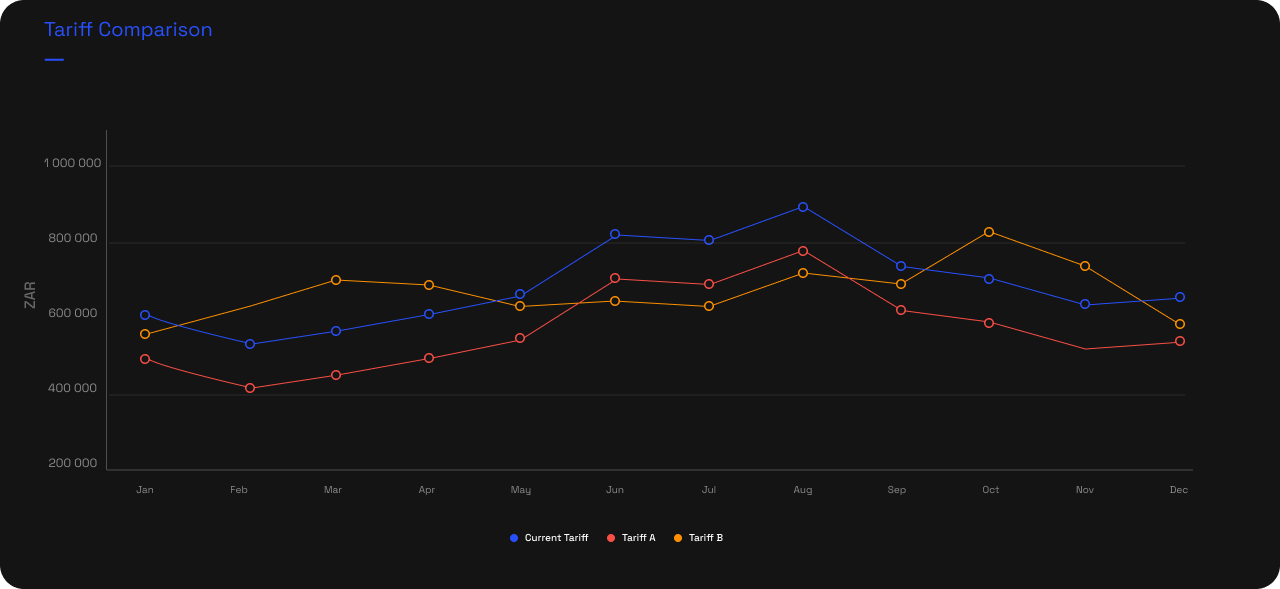
- Tariff Comparison Chart
This chart plots the current, and all loaded comparative tariffs monthly cost, for a 12 month period, based on actual site usage for that period.
- Tiles
- Tile 1
Clicking this tile opens the "Tariff scheme details" modal;. This will show all details, costs, and time of use information for your specific tariff loaded to the site, as well as historic tariff costs for the site.

- Tile 2
Clicking this tile will open a sub menu with 3 different support request options. Clicking either of these will create a ticket for one of our support staff to assist with your particular request.
The sub menu options are: - Request Tariff Investigation
- Verify Measurement Accuracy
- Request a call from a consultant

- Tile 3
This tile is dynamic and will show whether a possible saving is available through tariff migration. Clicking this tile will open a sub menu with 3 different support request options. Clicking either of these will create a ticket for one of our support staff to assist with your particular request.
The sub menu options are: - Request Tariff Investigation
- Verify Measurement Accuracy
- Request a call from a consultant

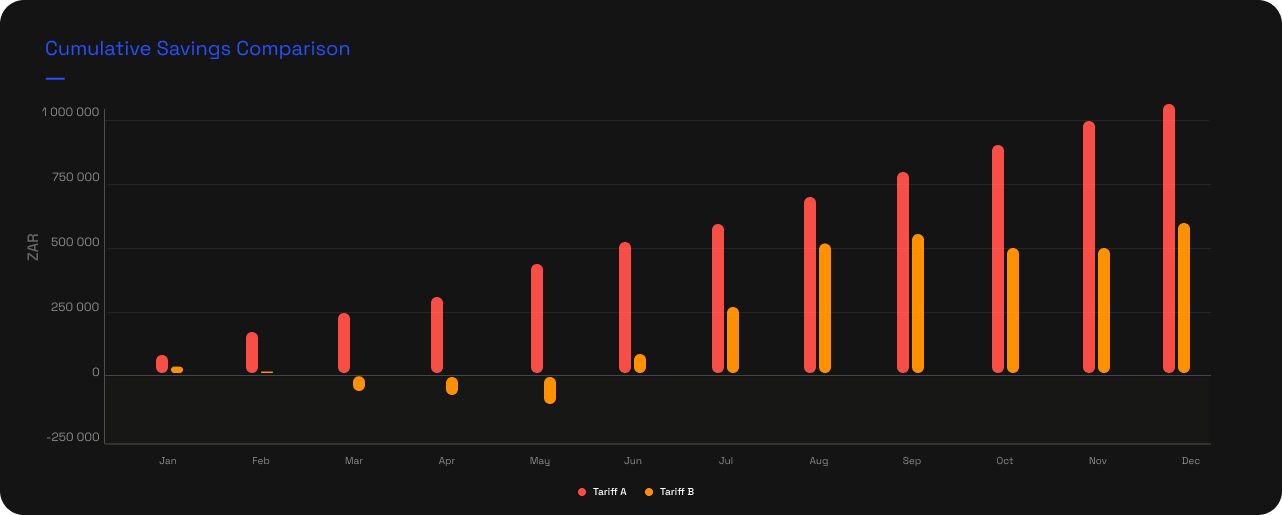
- Cumulative Savings Comparison Chart
This Chart shows the Cumulative Savings of each comparative tariff, for the 12 month period. Due to large changes in seasonal pricing, this chart allows you to visualise the cumulative savings over seasonal periods.
- Total Cost Chart
This Chart shows the Total cost over the 12 month period for your current and comparative tariffs.

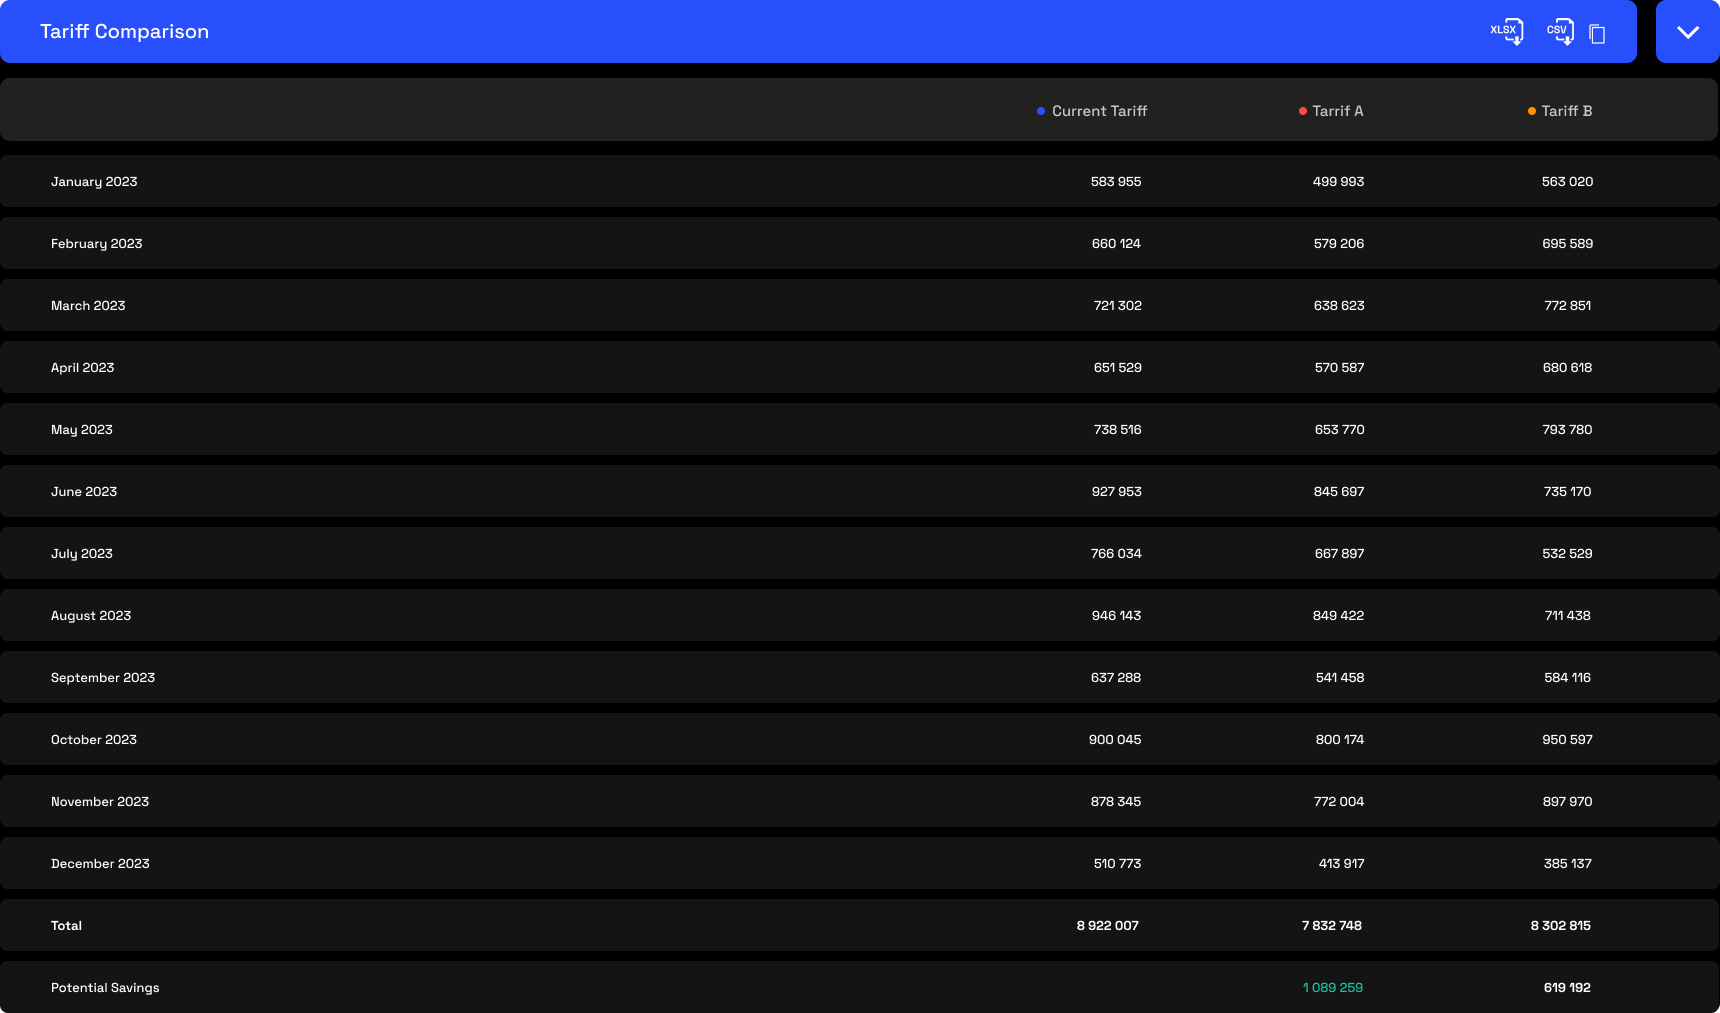
- Tariff Comparison Table
- Table Blue Bar
- Table Data Downloads
On the Far right hand side of the blue bar, there will be 3 icons.
XLSX - Download the table data in XLSX Format
CSV - Download the table data in CSV Format
Copy Table - Copy the table data to your clipboard. You are then able to paste the data in the sheet of your choice.
- Table Data
The Tariff Comparison Table gives a detailed, monthly breakdown of the data displayed in the above charts.
The chart ends with a annual total cost, and potential available savings, clearly indicating potential migration opportunities.
Related Articles
Page Overview - Bill Verification
Purpose of Page The Bill verification page is a tool that allows users to verify the accuracy of electricity billing by comparing council/Landlord measurements with what we measured for a specific billing period. We are then able to provide a ...
Page Overview - Dashboard
Purpose of Page The Utilities & Services Dashboard provides an executive daily overview of your energy usage. It also aims to provide energy insights through the use of graphic elements like heatmaps, to allow the visualisation of waste, savings ...
Page Overview - Dashboard
Purpose of Page The Utilities & Services Dashboard provides an executive daily overview of your energy usage. It also aims to provide energy insights through the use of graphic elements like heatmaps, to allow the visualisation of waste, savings ...
Page Overview - Charting
Purpose of Page The Charting page provides the user high levels of custom data viewing capabilities for any device, over any period, and for any available metric. It also allows for periods to be compared. This can provide insights on trends and ...
Page Overview - Charting
Purpose of Page The Charting page provides the user high levels of custom data viewing capabilities for any device, over any period, and for any available metric. It also allows for periods to be compared. This can provide insights on trends and ...