Page Overview - Bill Verification
Purpose of Page
The Bill verification page is a tool that allows users to verify the accuracy of electricity billing by comparing council/Landlord measurements with what we measured for a specific billing period. We are then able to provide a detailed and total variance percentage. Charting and detail data tables allow for variance trends to be identified, in order to assist with determining whether a billing dispute should be launched.
If a significant variance exists, please contact an Augos support representative to assist with verifying that the bill verifications have been completed correctly.
Once confirmed, a meter inspection and verification is recommended to determine the root of the problem.
Point Selector
Any Billing Point that the user has access to can be selected on this page.
Date Selector
No Date selector is available on this page. Each bill verification will be handled individually, each having a specific reading date that needs to be entered. This is handled in the "Add/Edit Bill Verification" Modal
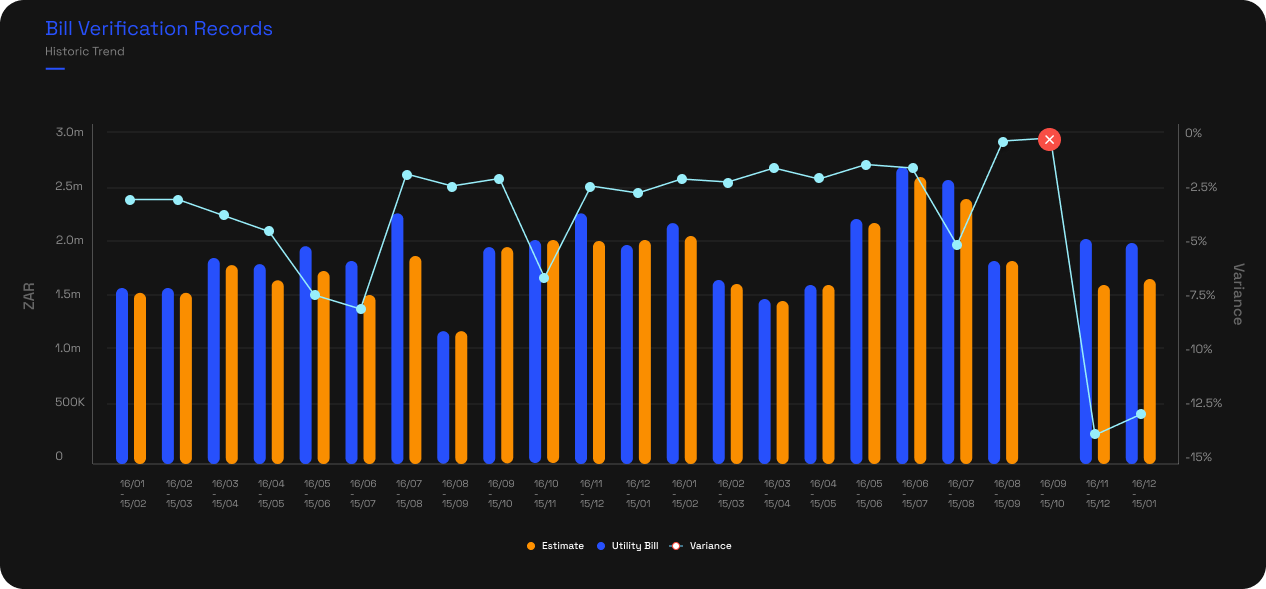
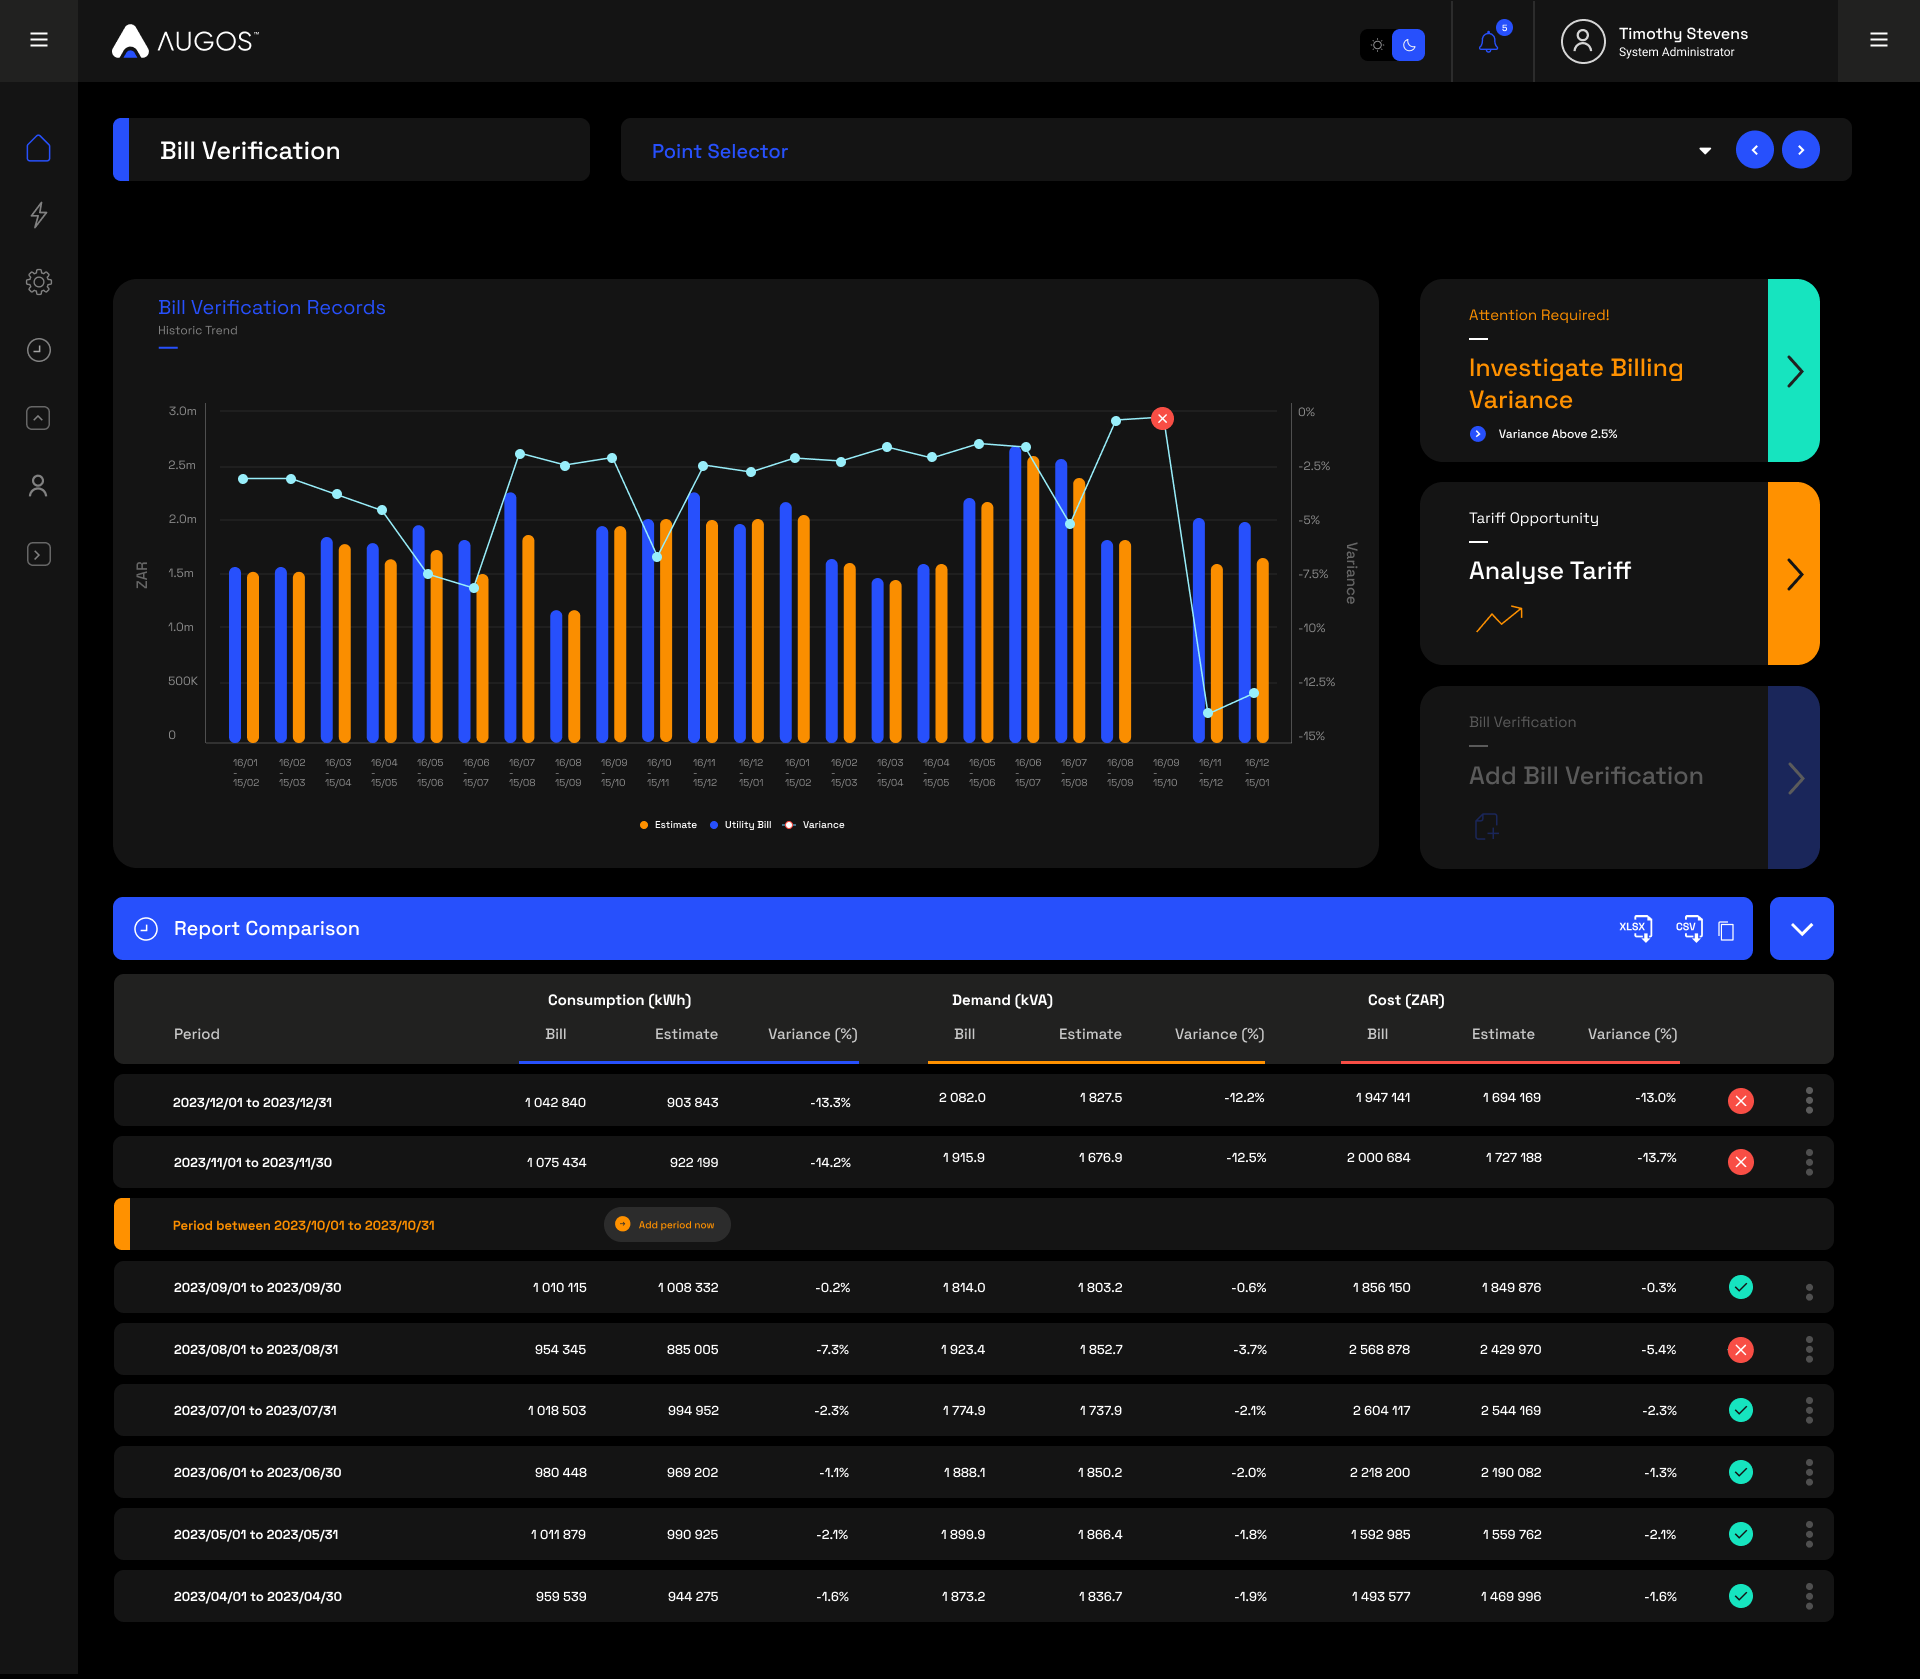
Bill Verification Records - Historic Trend Chart
This chart chows all bill verifications that have been done, for up to 24 months. The purpose is to show a visual trend of the total cost, and billing variance over time.
Available data is:
Total Estimate Cost (Orange Bar)
Total Utility Bill Cost (Blue Bar)
Total Cost Variance (Blue Line)
Tiles
Next to the Historic Trend Chart, are 3 Tiles. These are:
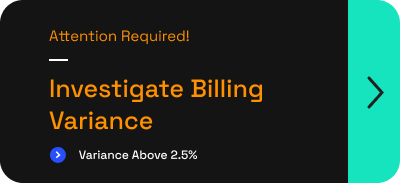
Tile 1
This is a dynamic tile that shows whether a billing investigation is required, based on the latest verifications that have been done.
Clicking this tile opens a sub menu. Sub menu options are
Request Billing Investigation
Request a call from a consultant
Verify Measurement Accuracy
Tile 2
This tile functions as a sub menu. Sub menu options are
View Tariff Scheme Details
View Tariff Scheme Comparison
Request Tariff Investigation
Request a call from a consultant

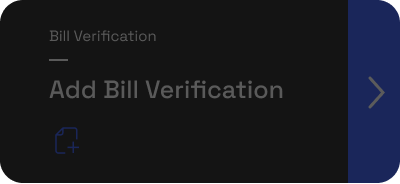
Tile 3
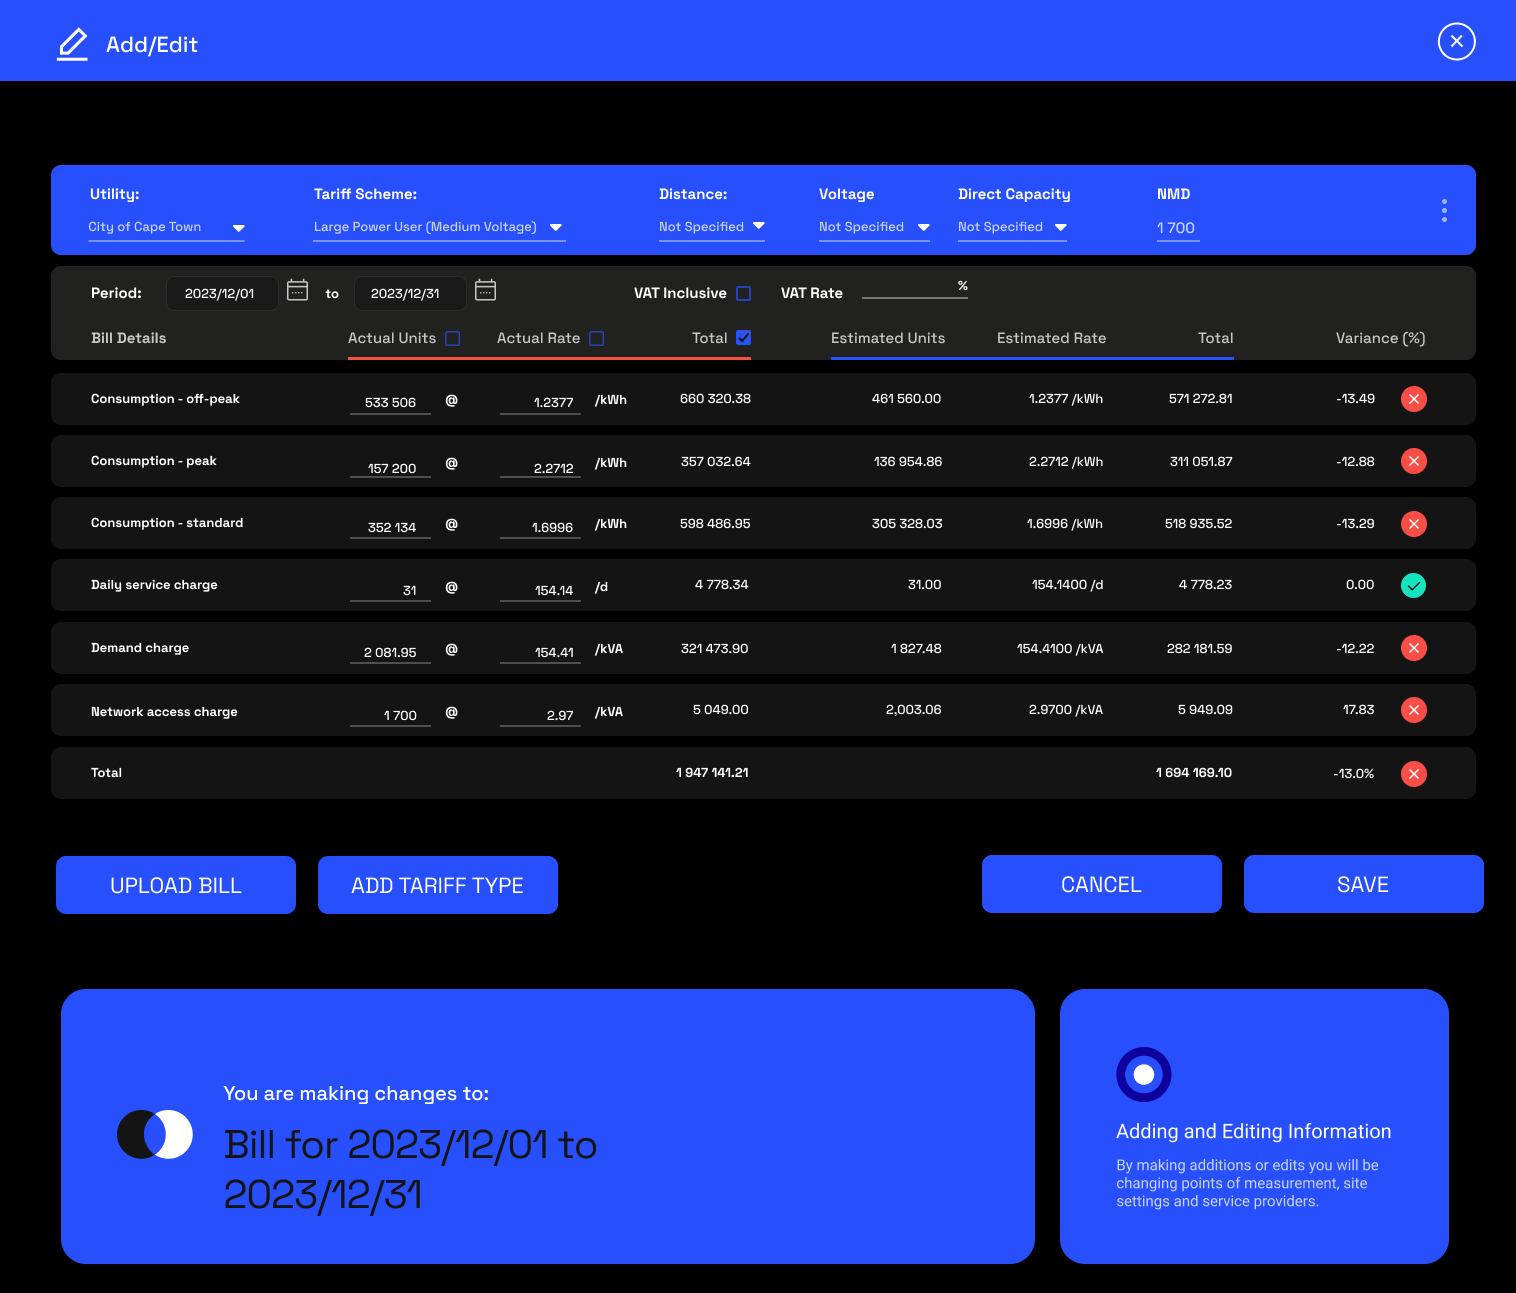
Clicking this tile opens the "Add/Edit Bill Verification" modal. When bill verifications are up to date, this button will not be clickable.
- Report comparison Table
Table Blue bar
Table Data Downloads
On the Far right hand side of the blue bar, there will be 3 icons
XLSX - Download the table data in XLSX Format
CSV - Download the table data in CSV Format
Copy Table - Copy the table data to your clipboard. You are then able to paste the data in the sheet of your choice.
- Table Data
- This table lists every bill verification that has been completed for the billing point being viewed.
It provides a quick overview of Estimate, Bill and Variance data for Consumption (kWh), Demand (kVA) and Cost. - Periods that have no bill verifications loaded are indicated with an orange row with a button "ADD PERIOD NOW"
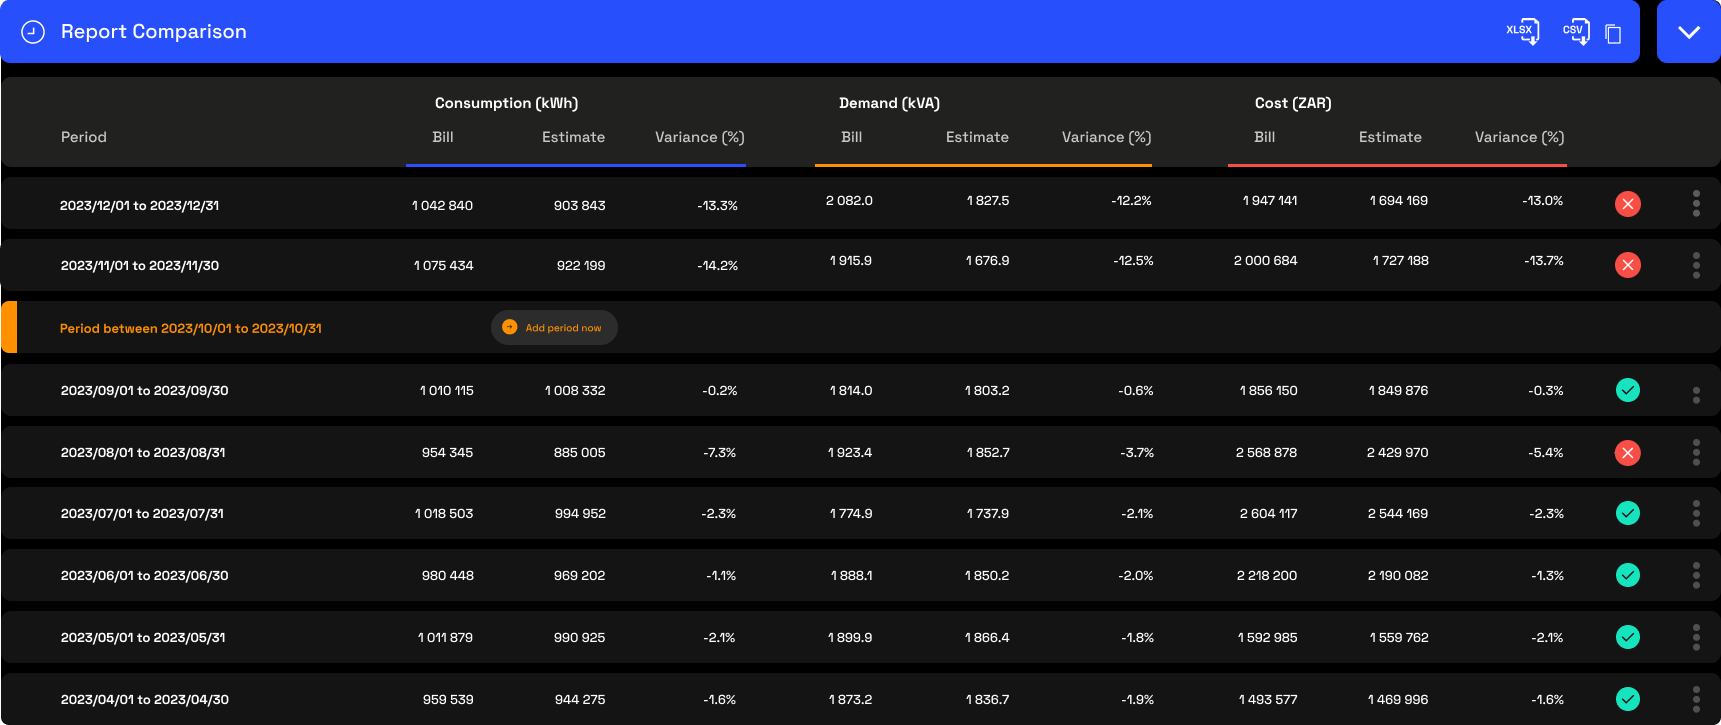
- 3 Dot Menu
Each row has a 3 dot menu that allows you to navigate to:
- View Details
This opens a separate modal that displays a specific reading dates bill verification details.
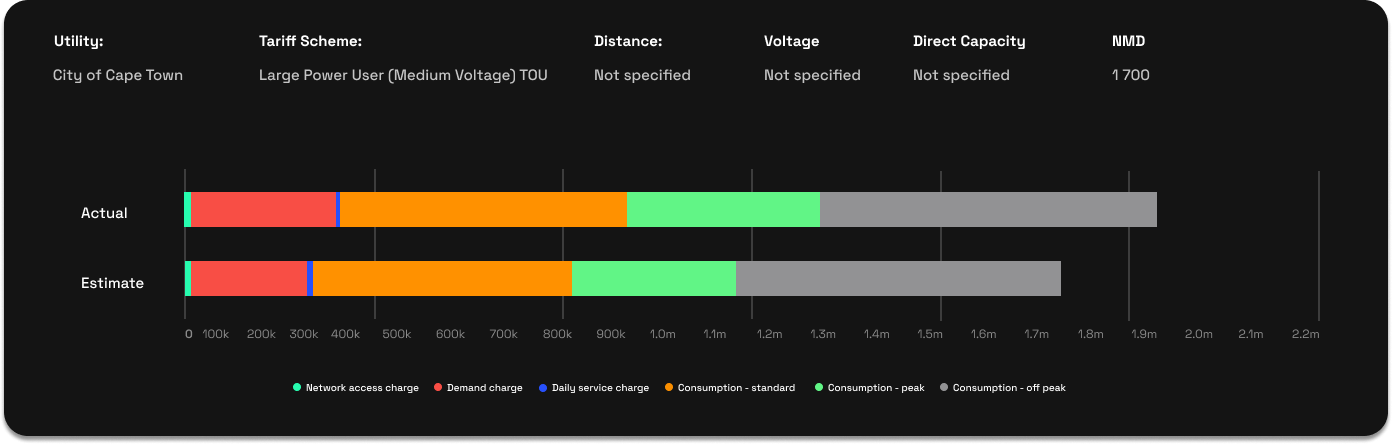
- Bill Details Bar Chart
This chart provides a quick overview of the Actual vs Estimate costs, broken down into specific tariff line items.
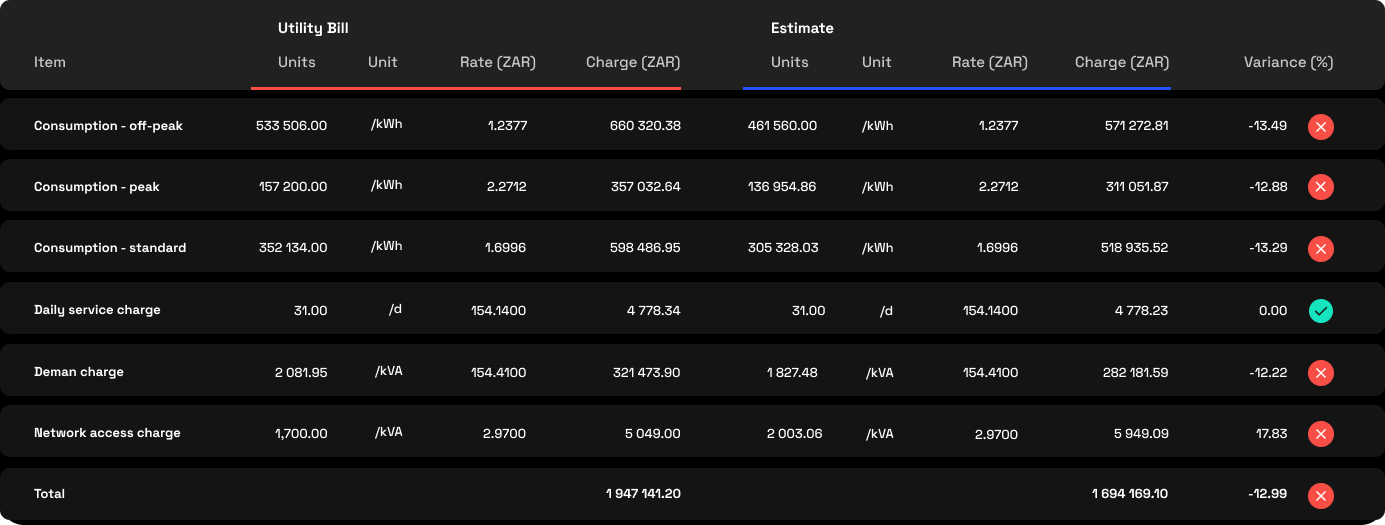
- Bill Details Table
- Table Blue bar
- Table Data Downloads
On the Far right hand side of the blue bar, there will be 3 icons
- XLSX - Download the table data in XLSX Format
- CSV - Download the table data in CSV Format
- Copy Table - Copy the table data to your clipboard. You are then able to paste the data in the sheet of your choice.
- Table Data
This Table give a detailed view with all tariff line items listed, each with its own variance calculated.
Edit Details
This menu Item opens the "Add/Edit Bill Verification" Modal. Should changes need to be made to an existing bill verification, this is where it will be done.
View Bill
If the user has uploaded the actual bill as a file, it can be viewed by clicking "View Bill"
View Tariff Scheme Details
This opens the Tariff scheme details modal. This provides a detailed view of the tariff loaded to the selected billing point.
Related Articles
Page Overview - Cost Allocation
Purpose of Page Where the cost breakdown page allocates all billing point costs according to usage through the entire hierarchy, the cost allocation page allows for custom internal energy cost allocation according to your organisation's specific ...
Page Overview - Charting
Purpose of Page The Charting page provides the user high levels of custom data viewing capabilities for any device, over any period, and for any available metric. It also allows for periods to be compared. This can provide insights on trends and ...
Page Overview - Charting
Purpose of Page The Charting page provides the user high levels of custom data viewing capabilities for any device, over any period, and for any available metric. It also allows for periods to be compared. This can provide insights on trends and ...
Page Overview - Cost Breakdown
Purpose of Page The Cost Breakdown page provides a detailed energy cost view of the entire site, providing both a full cost breakdown of the billing point into the individual tariff line items, as well as apportioning the total cost to all installed ...
Page Overview - Data Download
Purpose of Page The Data Download function provides access to raw data downloads for any measurement point, over any period, and in your preferred table format. Select Measurement point All measurement points and types can be selected. Choose the ...