Page Overview - Augos Load Curtailment User Manual
- Purpose of Page
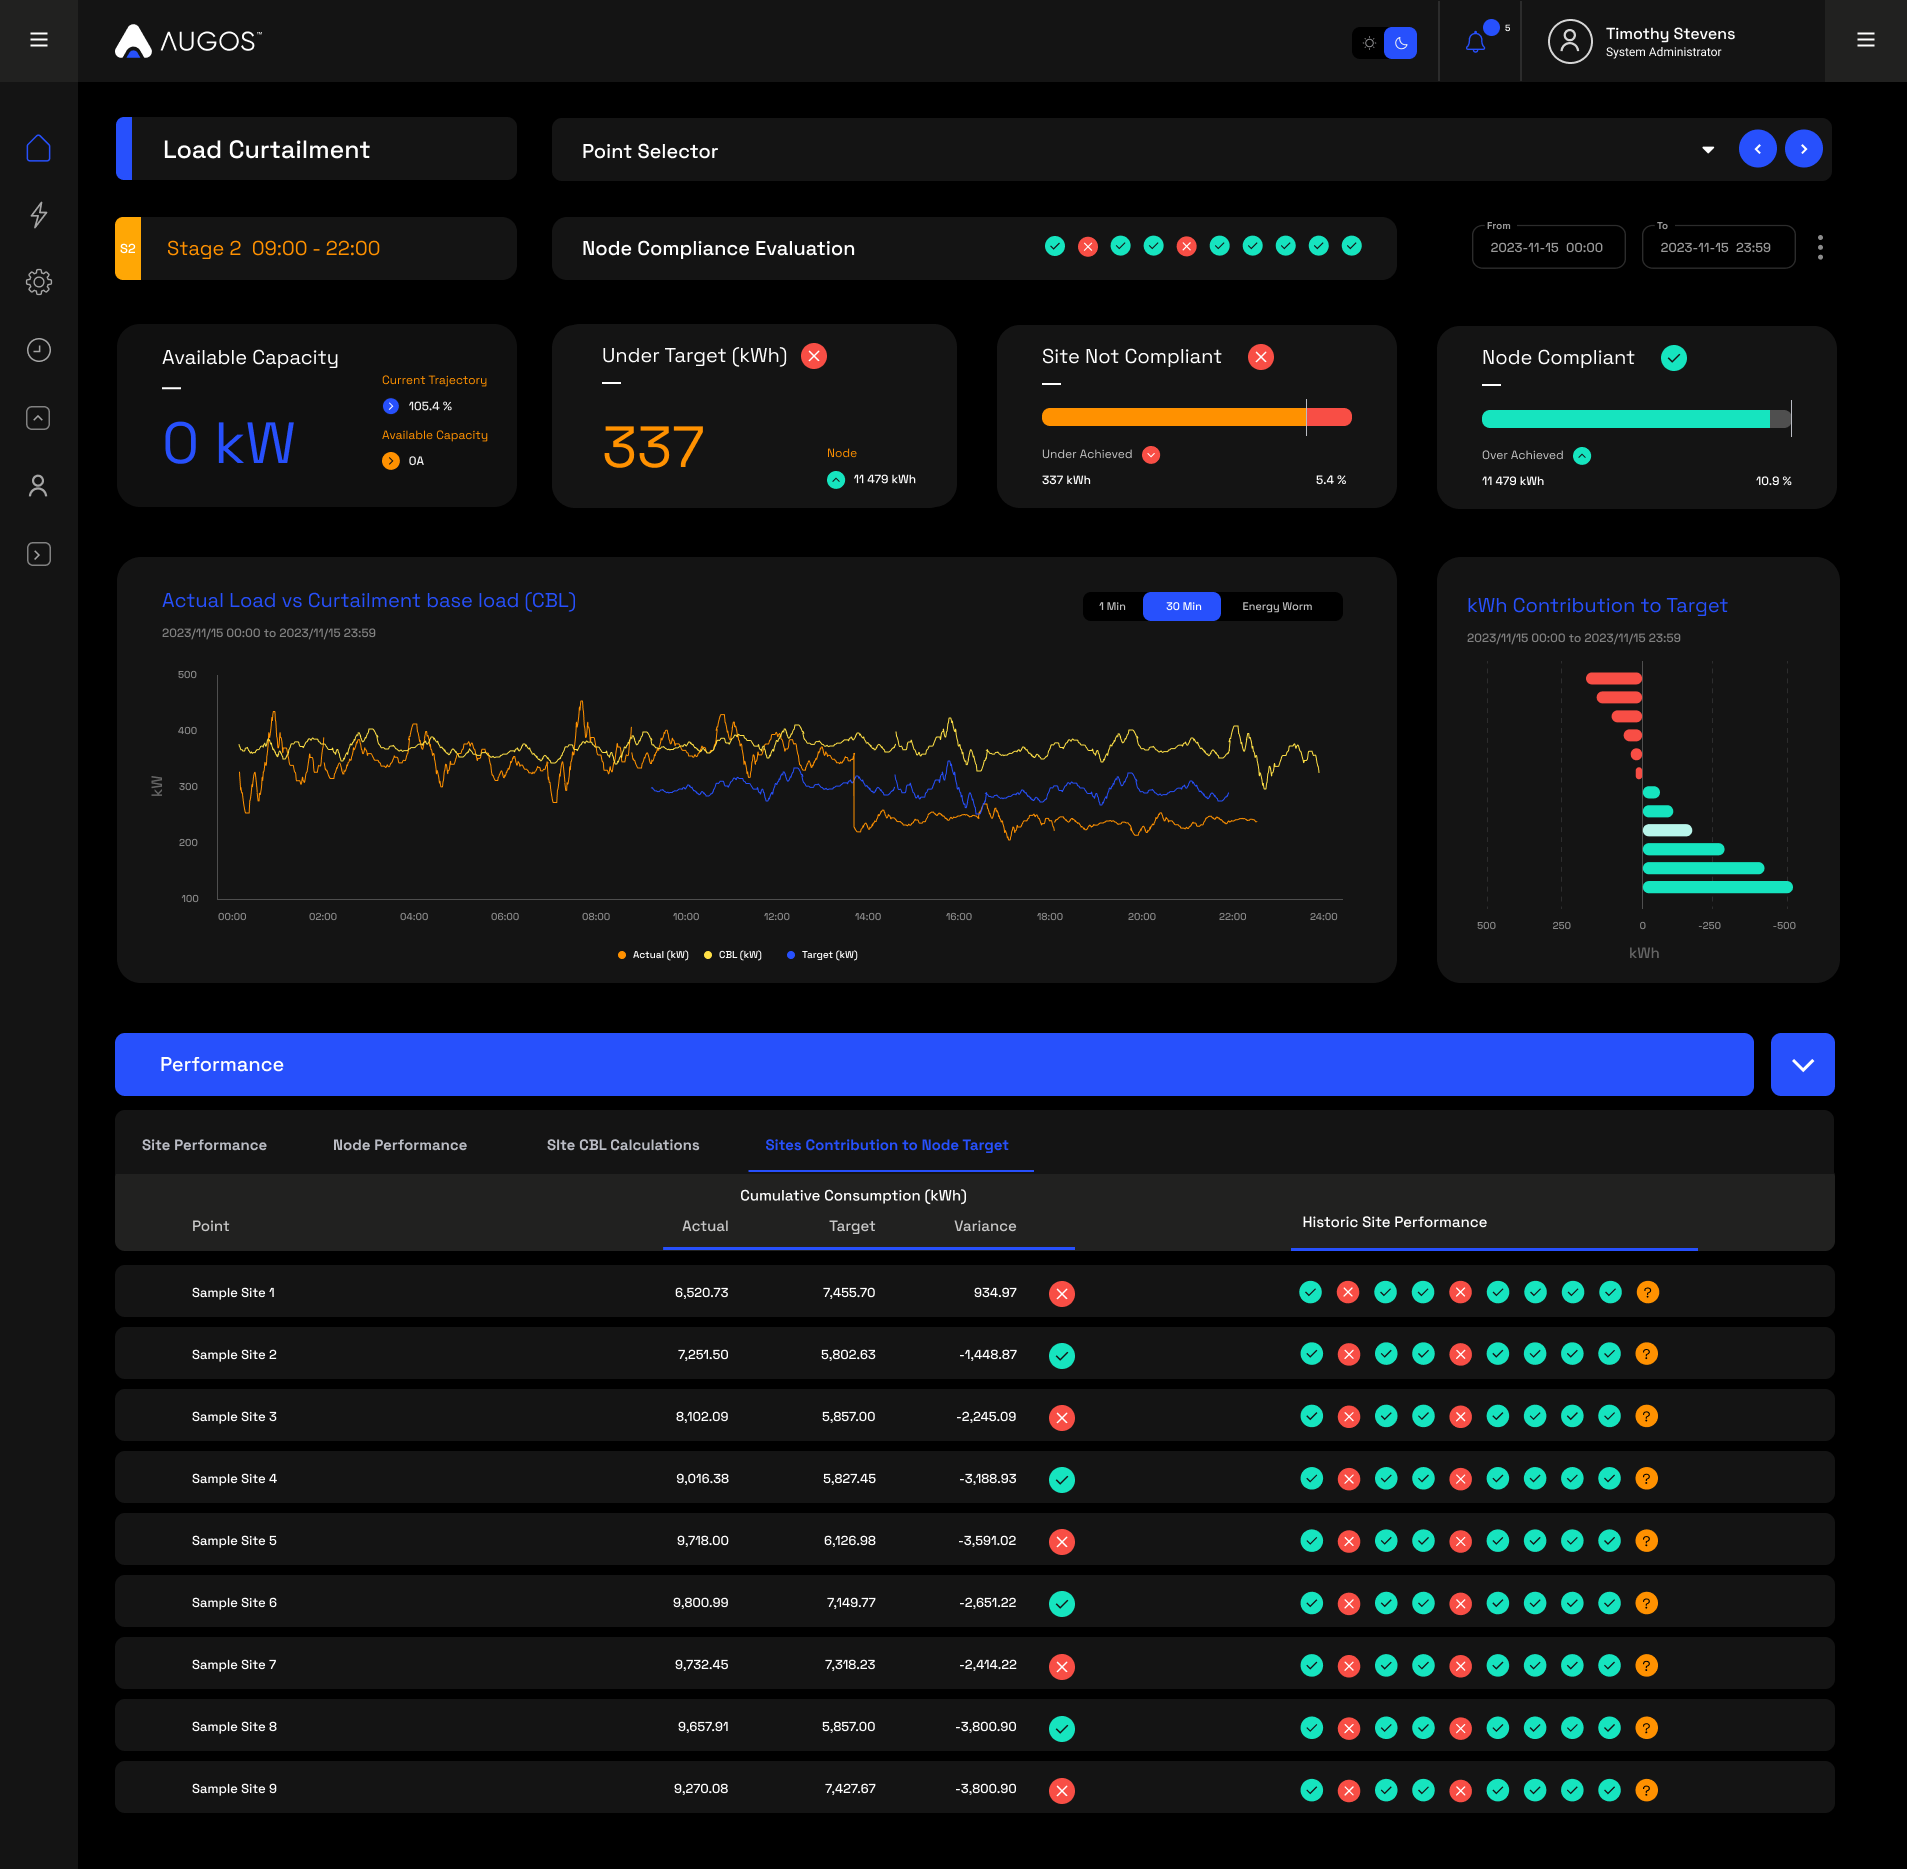
The purpose of this page is to allow Load Curtailment nodes, and individual node participants to see and manage their load reduction, in real-time. It is important to note that this page is modelled according to the code of practice, NRS 049-9 2023 Edition 3, and allows for Load Curtailment to be effectively implemented and monitored.
- Point Selector
Only "Sites" and points that have been loaded to a Load Curtailment node/program can be selected on this page.
- Date Selector
- Load Shedding
This date selector is unique to this page.
Load Shedding days are circled with a blue ring, and any of those single load curtailment days can be selected.
Non Load Shedding days are greyed out and cannot be selected.
- 3 Dot Menu
The 3 Dot menu next to the date selector will allow you to: - Navigate to our data download modal, giving you the option of downloading your preferred data.
- Load Shedding Stages Indicator
This indicates indicates the up-and-coming or the current stage of load shedding, with the start and end time of the load shedding period.

- Headline Data Tiles
These tiles are used to provide a snapshot view of the status of the site being viewed, as well as the relevant node.
This information can then be interrogated further down the page.
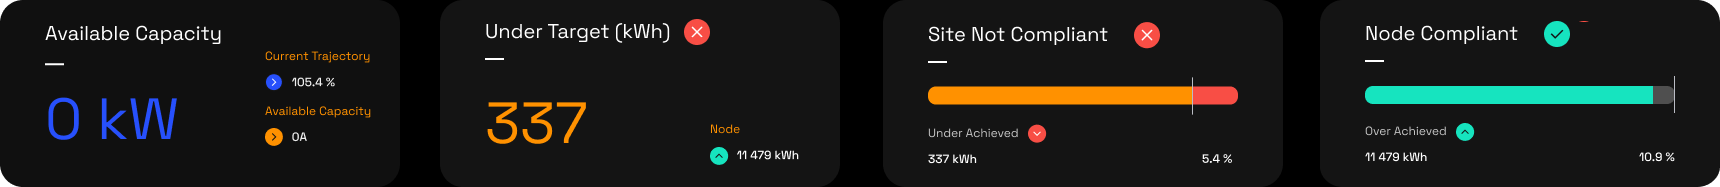
These tiles are: - Tile 1: Available Capacity / Reduce Load
This dynamic tile changes based on the sites performance. - When the site status is "Over Achieved" the tile will display "Available Capacity"
- The main Blue value indicated the additional kW that can be utilised, and still stay within the targeted reduction value
- "Available Capacity" on the bottom right hand corner of the tile displays this same value, but in amperage.
- "Current Trajectory" at the top right-hand side of the tile shows the projected over or under performance based on current data
- When the site status is "Under Achieved" the tile will display "Reduce Load"
- The main Blue value indicated the kW reduction needed in order to hit the targeted reduction value
- "Reduce Load" on the bottom right hand side displays this same value, but in amperage.
- "Current Trajectory" at the top right-hand side of the tile shows the projected over or under performance based on current data
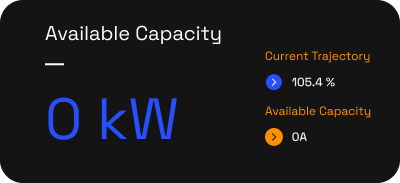
- Tile 2: Over / Under Achieved
This dynamic tile changes based on the sites performance. - When the site is doing better than required based on the current target, "Over Achieved" will be displayed.
- The main Green value displays the kWh that has been saved, additional to the target requirement.
- The "Node" value on the bottom right-hand side of the tile shows the same value, but for the node.
- The arrow next to the value indicates if the node is over or under achieving.
- When the site is doing worse than required based on the current target, "Under Achieved" will be displayed.
- The main Red value displays the kWh that has been used, additional to the target requirement.
- The "Node" value on the bottom right-hand side of the tile shows the same value, but for the node.
- The arrow next to the value indicates if the node is over or under achieving.
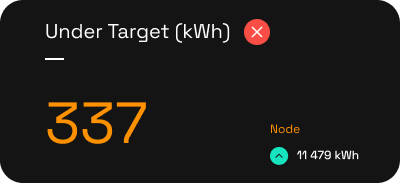
- Tile 3: Site Not Complaint / Compliant
This dynamic tile changes based on the sites performance. - When the site status is "Over Achieved" the tile will display "Site Compliant"
- The Bar Chart Displays
- The White line indicates the Target kWh in relation to the available time.
- The green bar indicates actual energy (kWh) consumed
- The "Over Achieved" value in the bottom left-hand side of the tile shows the kWh that has been saved, additional to the target requirement.
- The "%" value in the bottom right-hand side of the tile shows the sites Current Trajectory based on current data.
- When the site status is "Under Achieved" the tile will display "Site not Compliant"
- The Bar Chart Displays
- The White line indicates the Target kWh in relation to the available time.
- The green bar will now have changed to orange and indicates actual energy (kWh) consumed within the target value.
- The red bar indicates energy consumed outside of the available capacity.
- The "Under Achieved" value in the bottom left-hand side of the tile shows the kWh that has been used, additional to the target requirement.
- The "%" value in the bottom right-hand side of the tile shows the sites Current Trajectory based on current data.
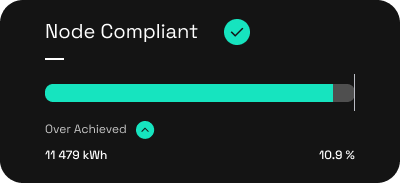
- Tile 4: Node Not Complaint / Complaint
This dynamic tile changes based on the Nodes performance. - When the site status is "Over Achieved" the tile will display "Node Compliant"
- The Bar Chart Displays
- The White line indicates the Target kWh in relation to the available time.
- The green bar indicates actual energy (kWh) consumed
- The "Over Achieved" value in the bottom left-hand side of the tile shows the kWh that has been saved, additional to the target requirement.
- The "%" value in the bottom right-hand side of the tile shows the sites Current Trajectory based on current data.
- When the site status is "Under Achieved" the tile will display "Node Not Compliant"
- The Bar Chart Displays
- The White line indicates the Target kWh in relation to the available time.
- The green bar will now have changed to orange and indicates actual energy (kWh) consumed within the target value.
- The red bar indicates energy consumed outside of the available capacity.
- The "Under Achieved" value in the bottom left-hand side of the tile shows the kWh that has been used, additional to the target requirement.
- The "%" value in the bottom right-hand side of the tile shows the sites Current Trajectory based on current data.
- Actual Load vs Curtailment Base Load (CBL)
This line chart shows a sites actual load, in comparison with the CBL profile, and subsequent target profile. - Chart Selector
In the top right-hand side corner of the chart is a selector with 3 options
- 1 Min
Displays non cumulative data in 1 minute interval - 30 Min
Displays non cumulative data in 30 minute interval - Energy Worm
Displays cumulative data in 1 minute interval
- Data displayed for the 1 Min and 30 Min charts are:
- Actual (kW): Orange line
- CBL (kW): Yellow line
- Target (kW): Blue line
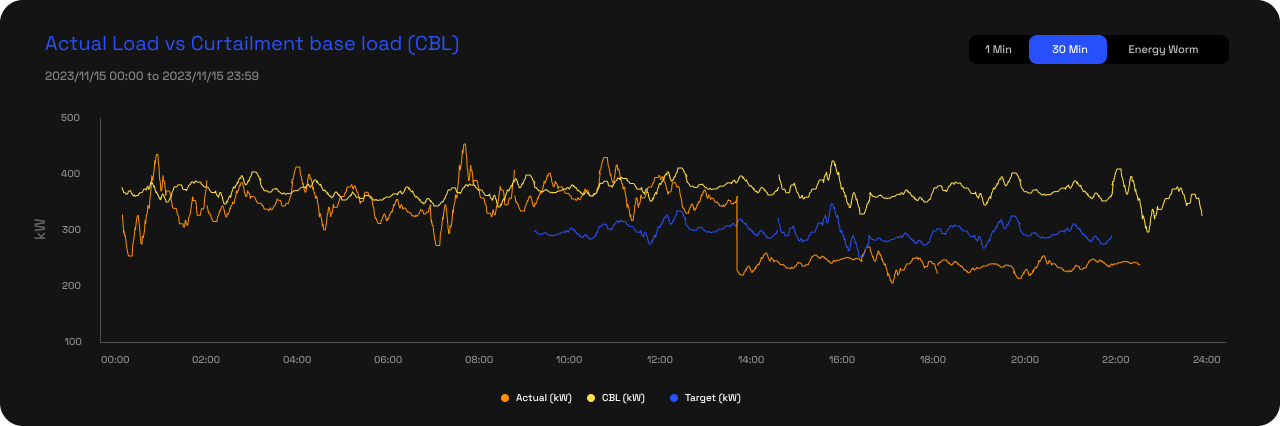
- Data displayed for the Energy Worm chart is:
- Actual (kWh): Orange line
- Target (kWh): Blue line
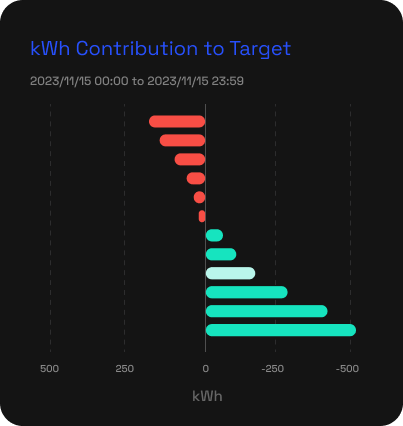
- kWh Contribution to Target
This chart shows each participant in the nodes over or under performance.
- Performance Table
- Table Blue bar
- Table Data Downloads
On the Far right hand side of the blue bar, there will be 3 icons.
XLSX - Download the table data in XLSX Format
CSV - Download the table data in CSV Format
Copy Table - Copy the table data to your clipboard. You are then able to paste the data in the sheet of your choice.
- Table Data
At the top of the table is 4 Table data options: - Site Performance & Node Performance
These 2 tables show the exact same date type, one data set being for the site being viewed, and the other for the related Node.
These Performance tables give a 24-hour, 30 min interval breakdown of the site and node's performance.
The available data is: - Load Shedding Stage
A load shedding stage change is indicated by a row running the full horizontal width of the page. It will indicate the stage, as well as the start and end time of the load shedding period.
Each data row also indicates the relevant stage with an indicator on the far left-hand side edge of the row. S1 = Stage 1, S2 = stage 2, etc. - Consumption Schedule (kWh)
This provides a 30 minute, non cumulative schedule for the following values. - Actual
Actual usage for the 30min timestamp. - Target
Target usage for the 30min timestamp. - Variance
Difference between Target and Actual usage for the 30min timestamp. - Adj Target
Adjustment required on following Target values in order for the site or node to be compliant.
- Cumulative consumption (kWh)
This provides a cumulative view of the data for the following values.
- Actual
Actual cumulative usage measured up to that 30min timestamp. - Target
Target cumulative value up to that 30min timestamp. - Variance
Difference between Target and Actual usage up to that 30min timestamp. - The red cross, or green checkmark indicates cumulative non compliance or compliance for that timestamp.
- Available Energy
Based on the CBL Data, each site and node starts an evaluation period with a set available kWh to consume. Once this energy has been consumed, the site technically has no energy left and any further usage would mean certain non compliance. - Available kWh
- % of original allocated value that is still available
- Site CBL Calculation
This page aims to show users how a sites CBL is calculated.
Each utilities CBL calculation is handled different. For more information on your sites CBL calculations, please contact send a mail to lscp.support@augos.io .
- Site Contribution to Node Target
This page gives a list view of each site in a specific nodes contribution to that nodes target.
Data displayed is: - Cumulative consumption (kWh)
This provides a cumulative view of the data for the following values.
- Actual
Actual cumulative usage measured up to that 30min timestamp. - Target
Target cumulative value up to that 30min timestamp. - Variance
Difference between Target and Actual usage up to that 30min timestamp. - The red cross, or green checkmark indicates cumulative non compliance or compliance for that timestamp.
- Historic Site Performance
This shows the last 10 load curtailment days compliance for each site.

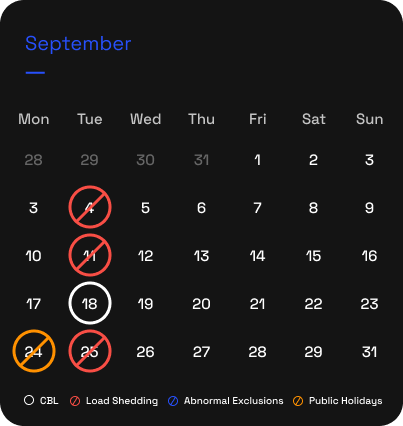
- CBL Days Calendar
This 12 months calendar view shows the below information for all relevant days over a 12 month period. - CBL
White circles indicate days that are used for the site CBL Calculations - Load Shedding
Red, crossed out Circles indicate Load Shedding days - Abnormal Exclusion Days
Blue, crossed out circles indicate days that have been excluded from CBL day selection due to reasons like strike action. - Public Holiday
Orange, crossed out circles indicate days that have been excluded from CBL day selection due to public holidays.
Related Articles
Augos Load Curtailment User Manual
Purpose of the Load Curtailment section of the Augos Platform Load Curtailment allows nodes, and individual node participants to see and manage their load reduction, in real-time. Below is a snippet of how the page looks, and after that are ...
Page Overview - Bill Verification
Purpose of Page The Bill verification page is a tool that allows users to verify the accuracy of electricity billing by comparing council/Landlord measurements with what we measured for a specific billing period. We are then able to provide a ...
Page Overview - Triggers
Purpose of Page The Triggers function allows users to create custom alerts for any device, in order for the system to send the user a notification once the specified parameter measures outside the specified conditions. Notifications are sent via: ...
Page Overview - Triggers
Purpose of Page The Triggers function allows users to create custom alerts for any device, in order for the system to send the user a notification once the specified parameter measures outside the specified conditions. Notifications are sent via: ...
Page Overview - Tariff Comparison
Purpose of Page The purpose of this page is to allow customers to compare their current electricity tariff, with other available tariffs in order to see if any savings potential is available through a tariff migration. Customers do not have free ...