Augos Load Curtailment User Manual
Purpose of the Load Curtailment section of the Augos Platform
Load Curtailment allows nodes, and individual node participants to see and manage their load reduction, in real-time. Below is a snippet of how the page looks, and after that are explanations of each sub-section. Click on "Utilities & Services" menu next to the Augos Logo and then on "Load Curtailment".
Load Curtailment allows nodes, and individual node participants to see and manage their load reduction, in real-time. Below is a snippet of how the page looks, and after that are explanations of each sub-section. Click on "Utilities & Services" menu next to the Augos Logo and then on "Load Curtailment".
Load Shedding Stages Indicator
This indicates indicates the up-and-coming or the current stage of load shedding, with the start and end time of the load shedding period.
Headline Data Tiles
These 4 tiles are used to provide a snapshot view of the status of the site being viewed, as well as the relevant node.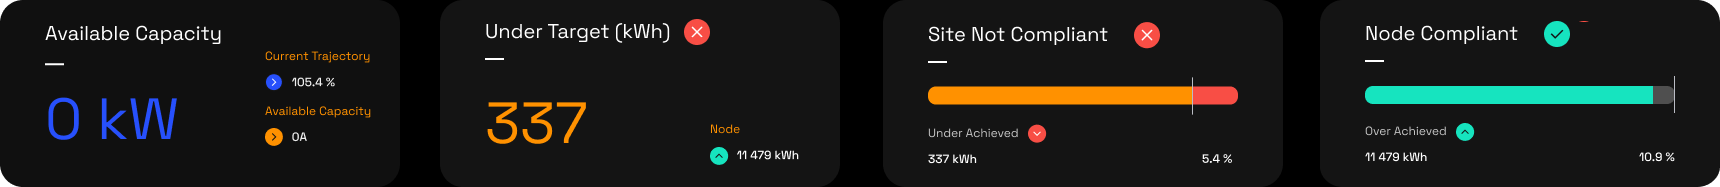
The 4 tiles are as follows:
- Tile 1; When the site status is "Over Achieved" the tile will display "Available Capacity", and when the site status is "Under Achieved" the tile will display "Reduce Load". This dynamic tile changes based on the sites performance.
- Tile 2; When the site is doing better than required based on the current target, "Over Achieved" will be displayed, and when the site is doing worse than required based on the current target, "Under Achieved" will be displayed. This dynamic tile changes based on the sites performance.
- Tile 3; When the site status is "Over Achieved" the tile will display "Site Compliant", and when the site status is "Under Achieved" the tile will display "Site not Compliant". This dynamic tile changes based on the sites performance. The White line indicates the Target kWh in relation to the available time. The "%" value in the bottom right-hand side of the tile shows the sites Current Trajectory based on current data.
- Tile 4; When the site status is "Over Achieved" the tile will display "Node Compliant", and when the site status is "Under Achieved" the tile will display "Node Not Compliant". This dynamic tile changes based on the Nodes performance. The White line indicates the Target kWh in relation to the available time. The "%" value in the bottom right-hand side of the tile shows the sites Current Trajectory based on current data.
Actual Load vs Curtailment Base Load (CBL)
This line chart shows a sites actual load, in comparison with the CBL profile, and subsequent target profile. There are 3 options available, with the 1 Min and 30 Min options displaying non-cumulative data in the respective intervals, and the Energy Worm option displaying cumulative data in 1 minute intervals.
kWh Contribution to Target
This chart shows each participant in the nodes over or under performance.
Performance Table
The top of the table displays 4 options:
- Site Performance & Node Performance: These Performance tables give a 24-hour, 30 min interval breakdown of the site and node's performance. A load shedding stage change is indicated by a row running the full horizontal width of the page. It will indicate the stage, as well as the start and end time of the load shedding period.
- Site CBL Calculation: This page aims to show users how a sites CBL is calculated. Each utilities CBL calculation is handled different. For more information on your sites CBL calculations, please contact send a mail to lscp.support@augos.io .
- Site Contribution to Node Target: This page gives a list view of each site in a specific nodes contribution to that nodes target. The data is displayed in cumulative consumption (kWh), and the Historic Site Performance is displayed, showing the last 10 load curtailment days compliance for each site
CBL Days Calendar
This 12 months calendar view shows the below information for all relevant days over a 12 month period.
This 12 months calendar view shows the below information for all relevant days over a 12 month period.
- CBL: White circles indicate days that are used for the site CBL Calculations
- Load Shedding: Red, crossed out Circles indicate Load Shedding days
- Abnormal Exclusion Days: Blue, crossed out circles indicate days that have been excluded from the CBL due to reasons like strike action.
- Public Holiday: Orange, crossed out circles indicate days that have been excluded from the CBL due to public holidays.
Related Articles
Page Overview - Augos Load Curtailment User Manual
Purpose of Page The purpose of this page is to allow Load Curtailment nodes, and individual node participants to see and manage their load reduction, in real-time. It is important to note that this page is modelled according to the code of practice, ...Page Overview - Triggers
Purpose of Page The Triggers function allows users to create custom alerts for any device, in order for the system to send the user a notification once the specified parameter measures outside the specified conditions. Notifications are sent via: ...Page Overview - Triggers
Purpose of Page The Triggers function allows users to create custom alerts for any device, in order for the system to send the user a notification once the specified parameter measures outside the specified conditions. Notifications are sent via: ...Page Overview - Tariff Comparison
Purpose of Page The purpose of this page is to allow customers to compare their current electricity tariff, with other available tariffs in order to see if any savings potential is available through a tariff migration. Customers do not have free ...How to Verify Billing Accuracy
Why Billing Verification is needed The impact of energy cost on businesses are constantly increasing, and businesses are realising that it is a critical measurement component that requires active management. Verifying that the energy you use is equal ...