Page Overview - Technical Analysis
Purpose of Page
The Technical Analysis Table displays all measurement points that are downstream from the point selected in the point selector.
It provides a quick view of the Last Activity and Consumption for each point, for the selected day, along with drop down charting and statistics to get to the exact metrics you need.
Point Selector
Any Point can be selected on this page.
All Sub metering points of the selected point is displayed below the selected point.
Date Selector
This page allows the use of custom date and time ranges. The following selection options are available:
Custom Date Range
Calendar Month
Billing Period
24 Month
Shifts
Single Day
Product Selector
The product selector allows you to switch between different energy types.
These include:
Electricity
Water
Fuel
Gas
- 3 Dot Menu
The 3 Dot menu next to the date selector will allow you to navigate to our data download modal, giving you the option of downloading your preferred data.
Technical Analysis Table
This table displays the point you selected in the point selector, as well as all measurement points that are downstream from that point.
It
provides a quick view of the Last Activity and Consumption for each
point, for the selected day, along with drop down charting and
statistics to get to the exact metrics you need.
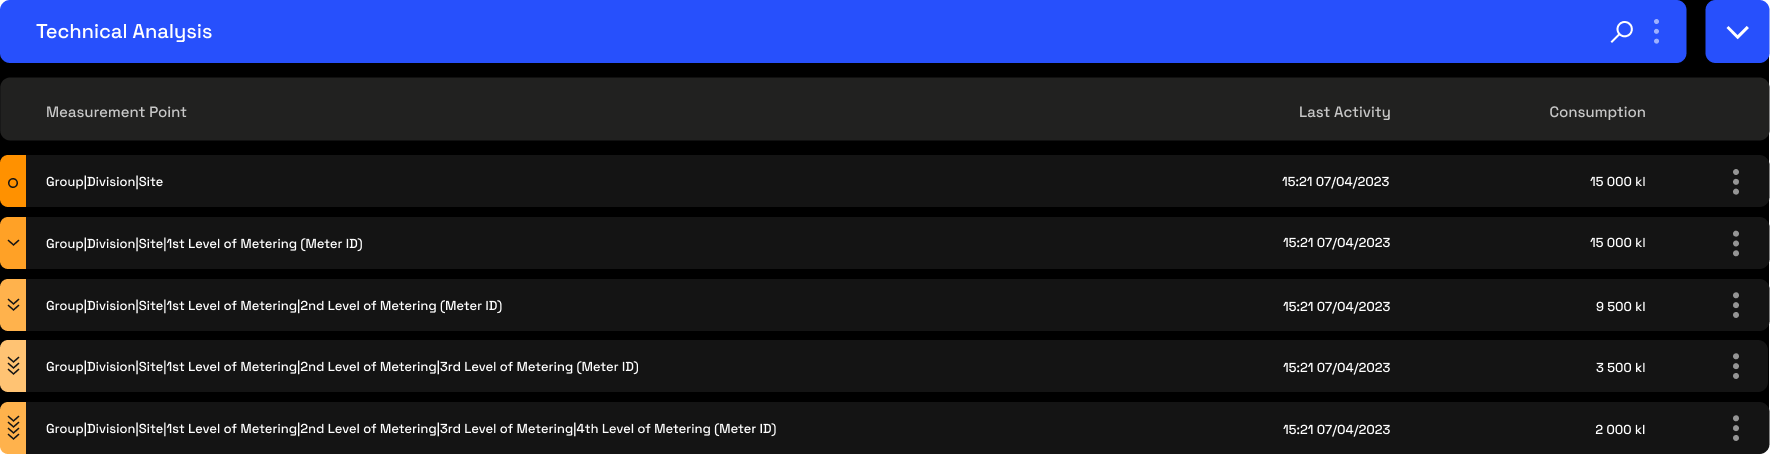
The left hand side of each rows displays the level of each point within the hierarchy.
o - This indicates that the point is at "Site" level and should display
the total consumption for the site. This should in most cases be a
virtual meter.
> - This indicates that the point is at the
first level down from the site. This can either be an actual, or virtual
meter.
>> - This indicates that the point is at the Second level down
from the site. This can either be an actual, or virtual meter. >>> - This indicates that the point is at the Third level down
from the site. This can either be an actual, or virtual meter.
>>>> - This indicates that the point is at the Fourth level down
from the site. This can either be an actual, or virtual meter.
Each meter at a specific level is a child of the level above it. This
structure is what creates our metering hierarchy. The hierarchy should
be seen as an energy flow and set up to ensure the site total is
accurate, all billing points are accurate, and that the sub meters are
fed from the correct parent meters.
Expanding Charts
When clicking on the hierarchy level indicator on the left hand side (orange block), the row will expand to display the consumption chart.
The chart gives the ability to zoom in on a specific time period by clicking and dragging between two points.
The slider below the chart also allows you to click and drag to change the date range you are viewing, without using the date selector.
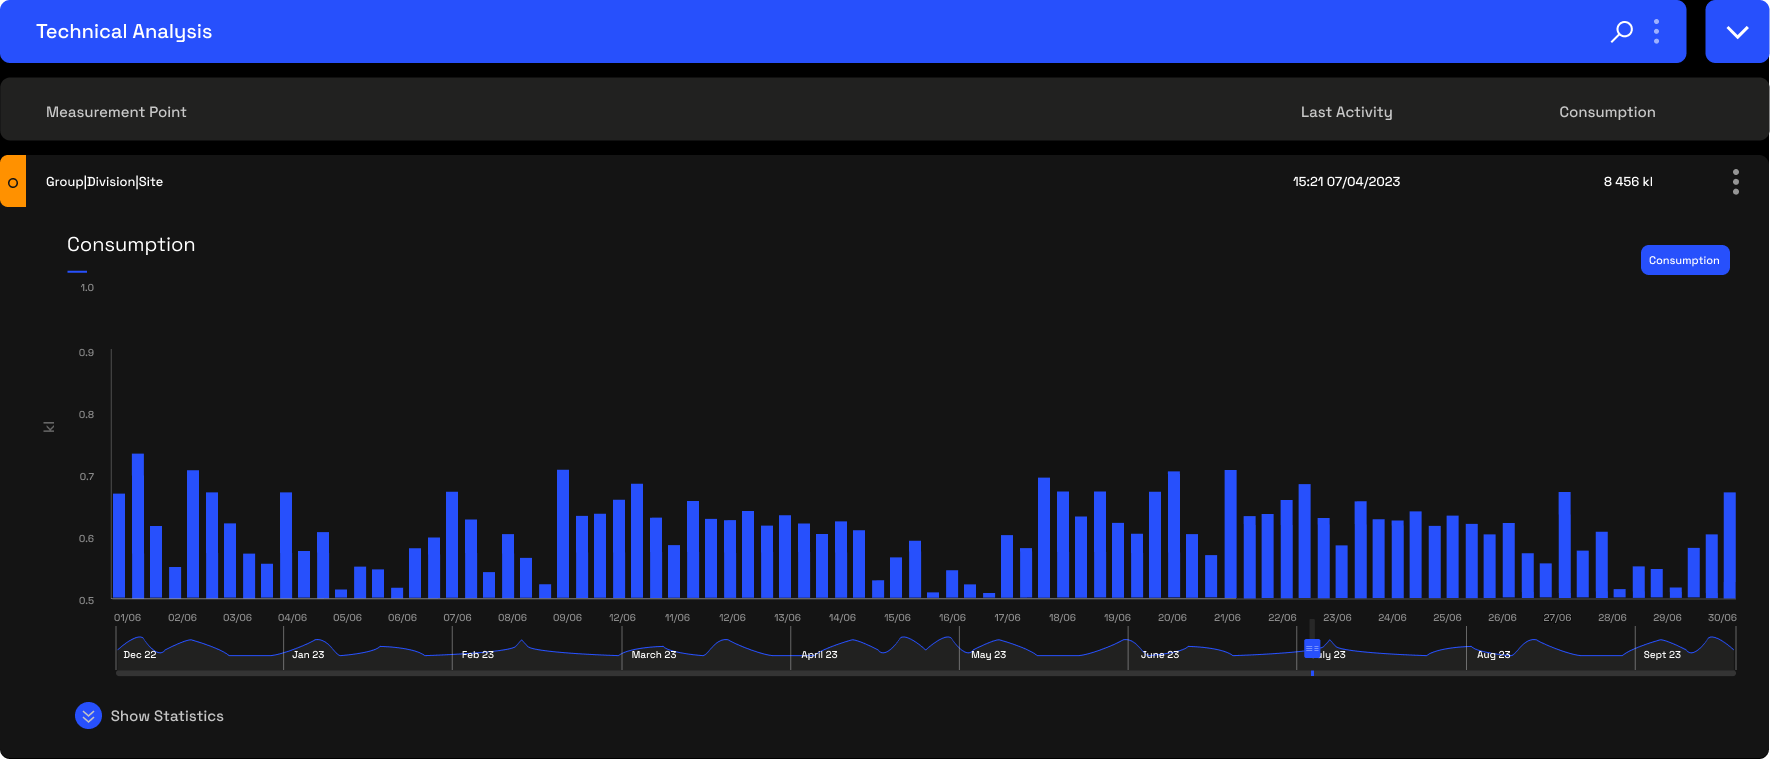
Expanding Statistics
Below the chart is a blue expansion button named "Show Statistics". Clicking this expands the statistics table that gives a table view of all energy metrics available for that point.
Related Articles
Page Overview - Technical Analysis
Purpose of Page The Technical Analysis Table displays all measurement points that are downstream from the point selected in the point selector. It provides a quick view of the Last Activity, Consumption, Demand and Power Factor for each point, for ...
Page Overview - Dashboard
Purpose of Page The Utilities & Services Dashboard provides an executive daily overview of your energy usage. It also aims to provide energy insights through the use of graphic elements like heatmaps, to allow the visualisation of waste, savings ...
Page Overview - Dashboard
Purpose of Page The Utilities & Services Dashboard provides an executive daily overview of your energy usage. It also aims to provide energy insights through the use of graphic elements like heatmaps, to allow the visualisation of waste, savings ...
Technical Analysis Table
The Technical Analysis Table displays all measurement points that are downstream from the point selected in the point selector. It provides a quick view of the Last Activity and Consumption for each point, for the selected day. The left hand side of ...
Technical Analysis Table
Technical Analysis Table This table displays the point you selected in the point selector, as well as all measurement points that are downstream from that point. It provides a quick view of the Last Activity and Consumption for each point, for the ...