Page Overview - Consumption Breakdown
Purpose of Page
The Consumption Breakdown page provides a detailed energy consumption flow view of the entire site. The hierarchy view makes it easy to visualise energy flow and pinpoint significant energy users, as well as over and under measurement on specific downstream points.
Consumption metrics are displayed for Electricity, Water, fuel, gas, and other consumptive measurement types.

Point Selector
Any Point that the user has access to can be selected on this page.
All Sub metering points of the selected point is displayed throughout the page.
Date Selector
This page allows the use of custom date and time ranges. The following selection options are available:
Custom Date Range
Calendar Month
Billing Period
24 Month
Shifts
Product Selector
The product selector allows you to switch between different consumptive energy types.
These include:
Electricity
Water
Fuel
Gas
- 3 Dot Menu
The 3 Dot menu next to the date selector will allow you to:
Navigate to our data download modal, giving you the option of downloading your preferred data.
Download a Consumption Breakdown PDF file, for the point and period selected.
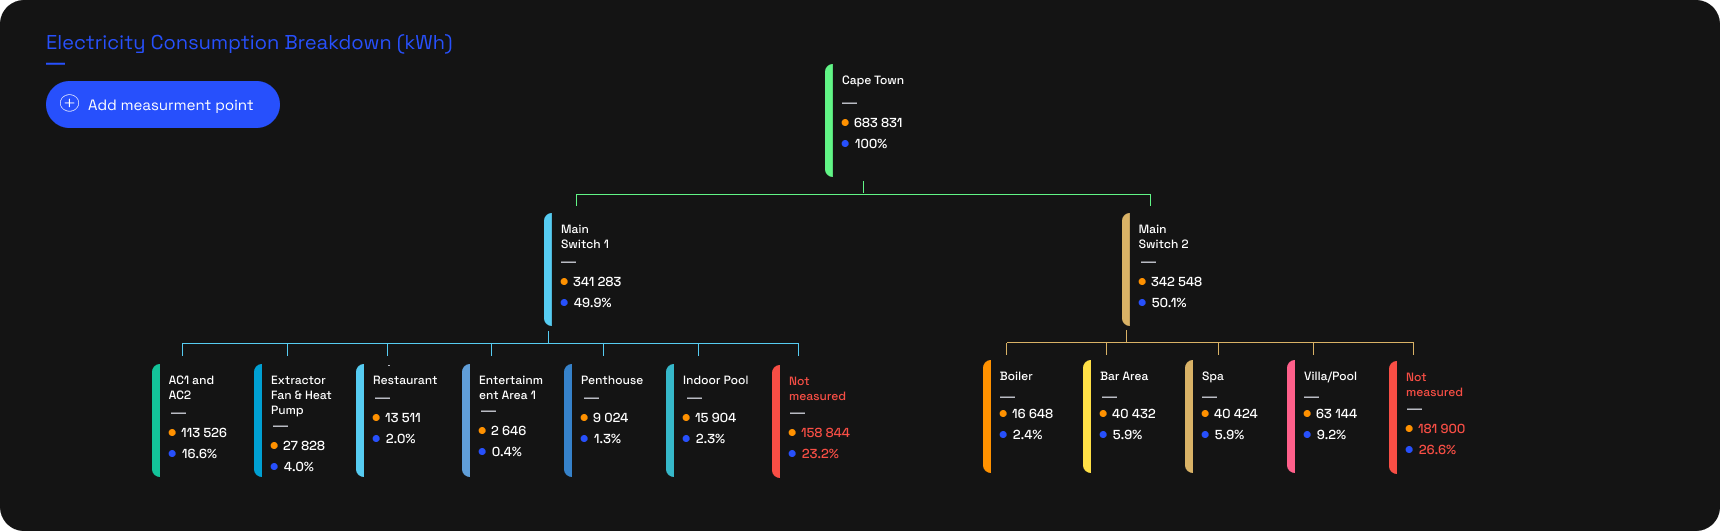
Energy Flow Diagram
This Chart gives a full hierarchical view of your installed measurement, allowing you to visualise energy flow.
The hierarchy layout allows you to get a detailed view of each point, with the link to:
Its parent meter (the meter 1 hierarchy level above it).
Its sibling meters (the meters that are on the same hierarchy level as it)
Its child meters (meters that are 1 hierarchy level below it).
Consumption value (kWh, kl, m3)
Percentage (%) that each points contributes to the total site (or selected point) consumption.
Not Measured & Over Measured
In cases where the sub points measurement total more (Over Measured) or less (Not Measured) than the parent meter, an additional virtual meter (virtual meters are points that do not have actual devices connected to them) is created and added, in red, below the parent meter in question.
This could indicate:
Where Not Measured, this could simply indicate that not all sub points are measured
Incorrect hierarchy where the relationship between meters and their parents/children are incorrect.
Incorrect CT or pulse ratios are loaded to one or more of the points, giving inaccurate readings.
Hardware or network related issues on one or more of the points, causing incomplete or inaccurate readings.
Bar & Donut Drill Down Charts
These 2 Charts work together to show consumption data in either a Broken down, multiple interval view (Bar Chart), or total consumption view (Donut Chart).
Bar Chart
The bar chart displays consumption data in one of 3 interval selections. The chart is stacked in order to display the contributions of your installed sub measurement to the selected parent meter. Change this view by utilisiing the drill down functionality.
Consumption interval options are:
Hover Data
Each Bar (Interval) as well as each sub meter over the selected period can be hovered individually.
The data displayed when hovered is:
Each Sub Measurement point consumption for the specific interval
Total consumption of all points for the specific interval
Donut Chart
The Donut Chart displays the total consumption values for each hierarchy level.
Drill Down
Functionality - If you have sub measurement installed, the donut chart
allows you to click on any of the sections. This will change the data in
both the bar and donut charts to display 1 hierarchy level deeper
(drilled down). This drill down can be done to the deepest level of
installed hierarchy.
Easily navigate back through the levels by clicking the blue "Back" button.
Hover Data
Hovering any of the sections of the donut will reveal the following data for that section.
Total Consumption of the hovered Sub measurement point
Percentage (%) contribution to site (or selected point) total consumption

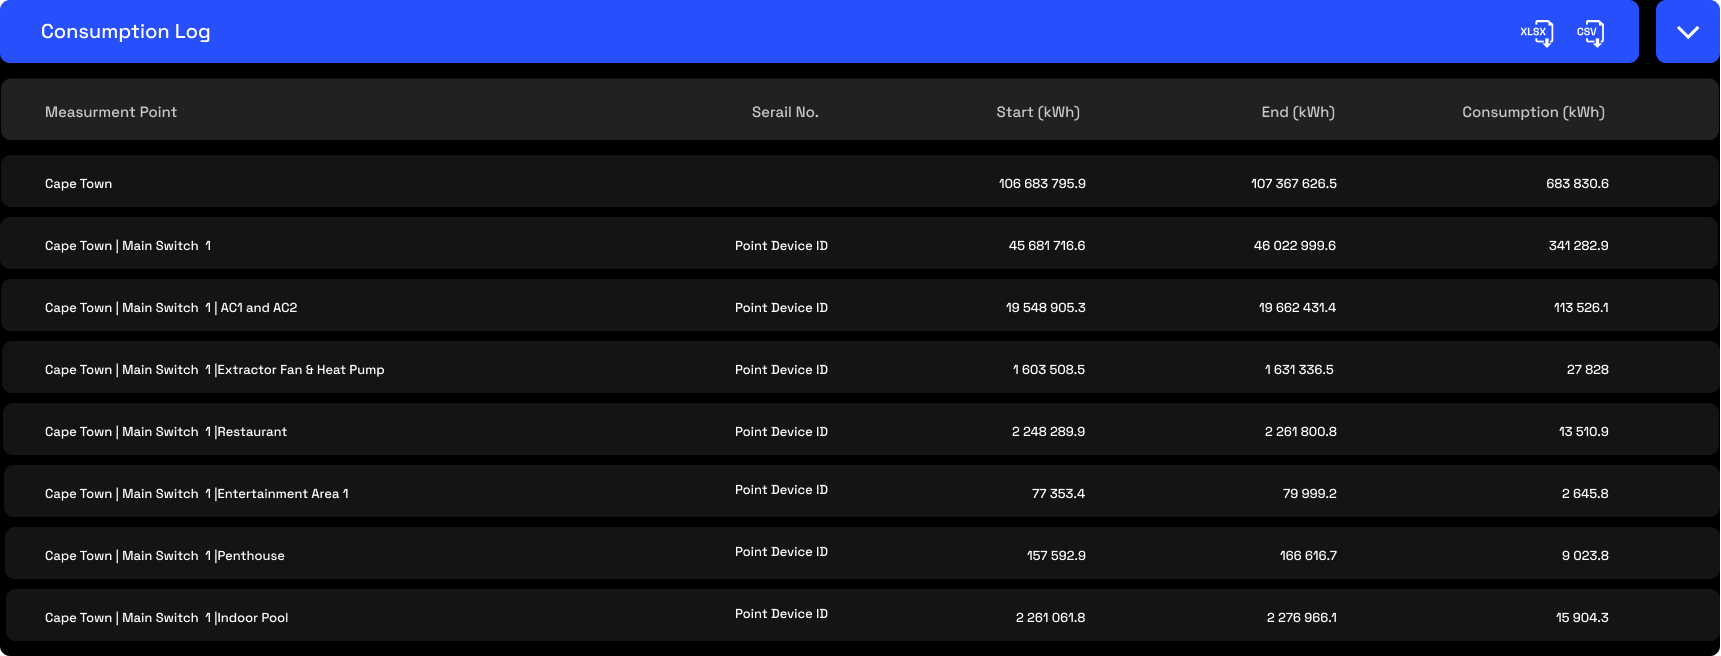
Consumption Log Table
The consumption Log is a table view of all measurement points (Selected point + all sub measurement points of the selected point).
The following data is available:
Measurement Point - Measurement Point Name
Serial No. - Device Serial No.
Start (kWh, kl, m3) - Consumption at the start of the selected period
End (kWh, kl, m3) - Consumption at the end of the selected period
Consumption (kWh, kl, m3) - Total Consumption for the selected period
Data Download
In the blue bar, you have 2 table download options. This will download the table data in your preferred format.
Format options are:
Related Articles
Page Overview - Cost Breakdown
Purpose of Page The Cost Breakdown page provides a detailed energy cost view of the entire site, providing both a full cost breakdown of the billing point into the individual tariff line items, as well as apportioning the total cost to all installed ...
Page Overview - Dashboard
Purpose of Page The Utilities & Services Dashboard provides an executive daily overview of your energy usage. It also aims to provide energy insights through the use of graphic elements like heatmaps, to allow the visualisation of waste, savings ...
Page Overview - Dashboard
Purpose of Page The Utilities & Services Dashboard provides an executive daily overview of your energy usage. It also aims to provide energy insights through the use of graphic elements like heatmaps, to allow the visualisation of waste, savings ...
Page Overview - Cost Allocation
Purpose of Page Where the cost breakdown page allocates all billing point costs according to usage through the entire hierarchy, the cost allocation page allows for custom internal energy cost allocation according to your organisation's specific ...
Page Overview - Data Download
Purpose of Page The Data Download function provides access to raw data downloads for any measurement point, over any period, and in your preferred table format. Select Measurement point All measurement points and types can be selected. Choose the ...